January 31, 2025
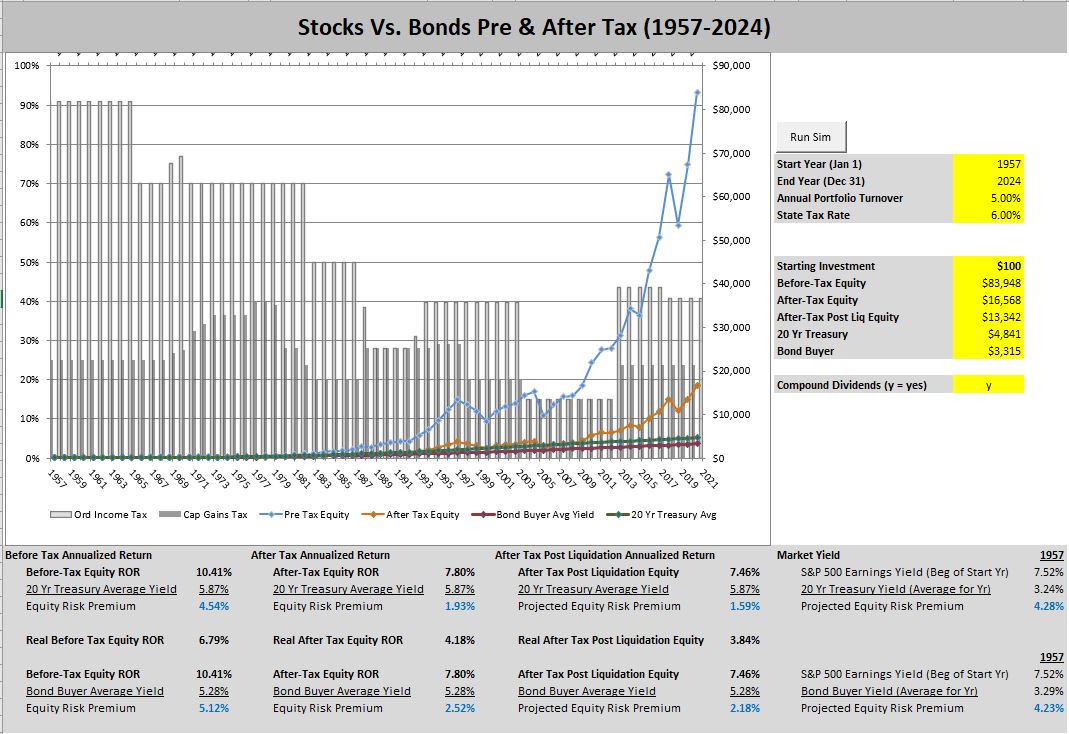
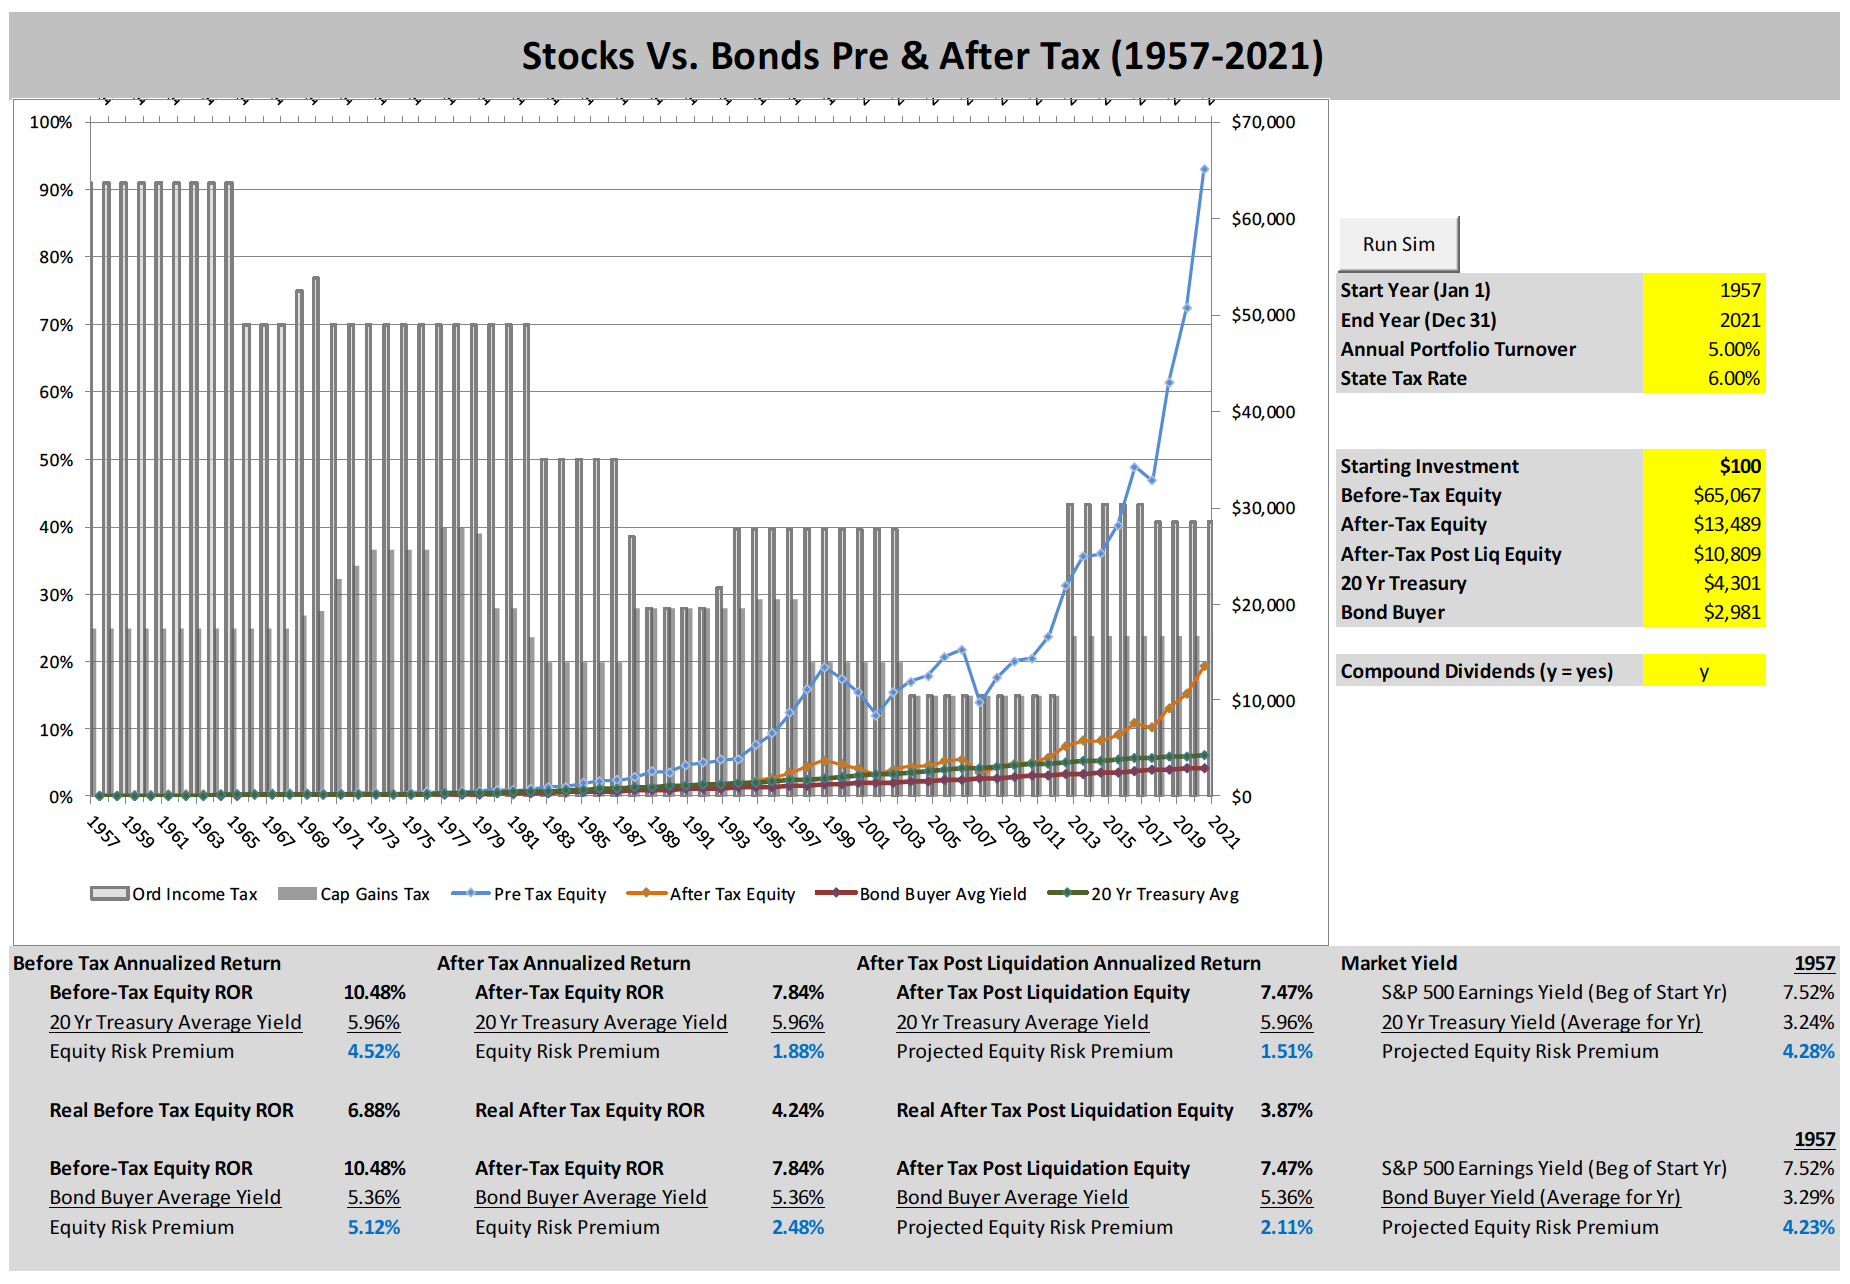
We are pleased to release the current version of our after-tax return model. This model shows the entire history of the S&P 500 Index with dividends reinvested. We apply the prevailing dividend taxation rate in the years they were earned, the prevailing long term capital gains rate on the 5% portfolio turnover and model for a 6% state tax. Highlights:
-The after-tax return of the S&P 500 since inception is 7.46% (1957-2024)
-The risk premium earned by non-taxable investors over this period was 4.54% (equity return-bond return). The equity risk premium compares 10.41% for equities versus 5.87% (average yield) for 20 year US treasury bonds.
-The after-tax risk premium earned by taxable investors was 2.18%. This measures the 7.46% (net) for equities versus 5.28% (average yield on the bond buyer 20 municipal bond index).
-IMPORTANT NOTE: For the entire 1/4 century beginning January 1, 2000 through December 31, 2024 INVESTORS DID NOT EARN A RISK PREMIUM IN EQUITIES VERSUS BONDS. The after-tax return of the S&P 500 Index was 5.71% and the average yield on the Bond Buyer Index at the start of that period was also 5.71%. Zero coupon, non-callable municipal bonds in the investor's home state earned the exact same compounded return in their bond portfolio as they did in their equity portfolio.
November 15, 2024
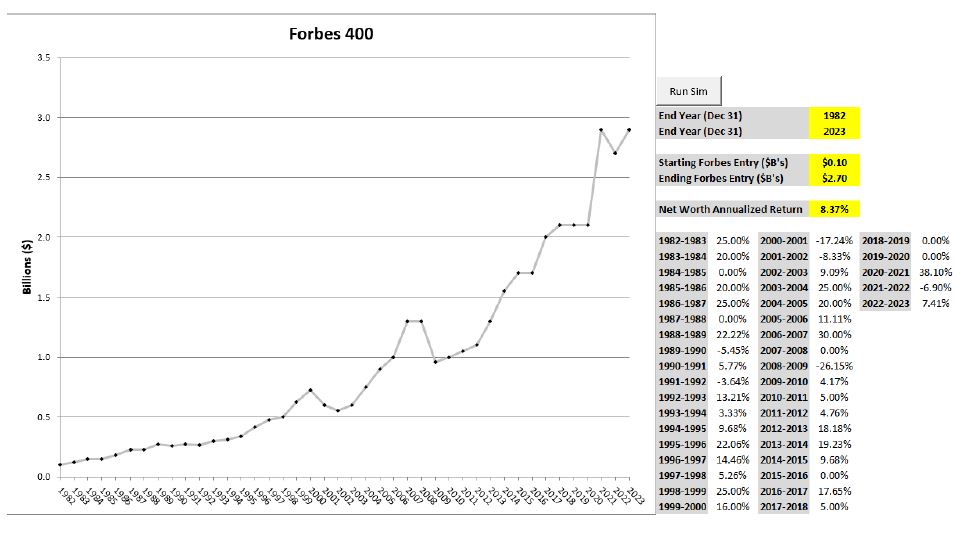
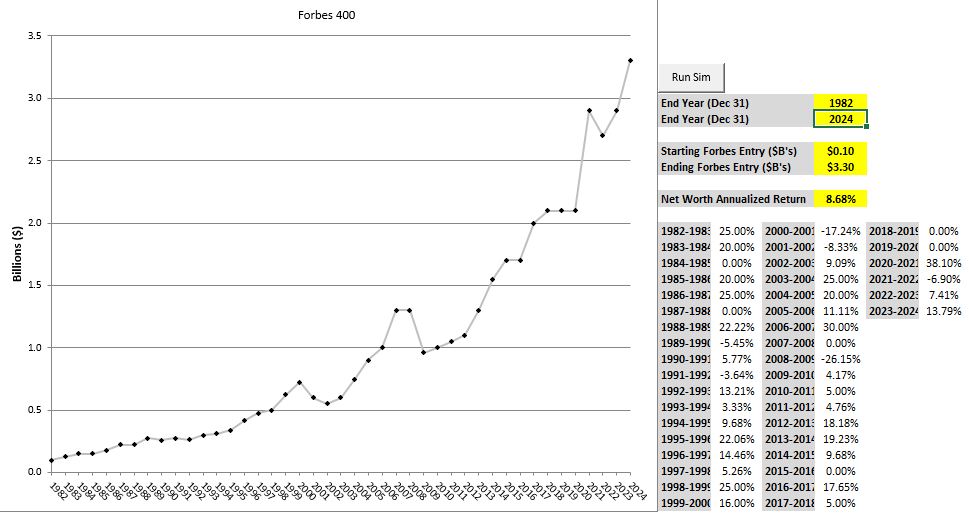
We are pleased to release the annual update to the Forbes 400th Index. The annual change in net worth necessary to secure a place on the 2024 Forbes 400 list was 13.79%. The compound annual growth rate of the index from its 1982 inception to today is 8.68%. The annual change represents growth (or decline) of total net worth net of taxes, philanthropic gifts, and spending.
December 19, 2023
Announcing the Gannon Group Forbes 400th index
We are pleased to reveal the index which tracks the annual change in total net worth to achieve a spot on the Forbes 400. In 1982, a total net worth of $100 million earned a spot on the list. In 2023, you would have needed a minimum of $2.9 billion to remain on the list. The compounded annualized return necessary to maintain the 400th position on the list from 1982-2023 was 8.37%.
We will continue to report on progress of the index over time including comparisons to US household net worth to give investors a portfolio benchmark for comparison.
September 12,2023
I'm challenging Wall Street Journal article on municipal bonds. (see link below). The article highlights the dangers of investor reliance on historical studies to inform of current opportunities.
The study claims to have used an "extensive data set" from April 08 (pre-financial crisis)-Dec 21 (near zero federal funds rate) which I believe is insufficient to support the claim. Historical yields on municipal bonds are available back to 1870.
Municipal bond yields do indeed offer investors a yield premium versus similar taxable issues with the yield today on the Bond Buyer Muni Index at 3.81% and a 20 year US Treasury at 4.55%. With the tax-exemption on the muni this is equivalent to a treasury bond yielding 6.43%, thus the muni offers a 41% yield premium on a tax equivalent basis. Think about that for a minute.
It is my opinion that investors should inform themselves of investment history but it is more important to measure current opportunities based upon current and forward looking data. That is how we guide our decisions.
https://www.wsj.com/finance/investing/municipal-bonds-tax-free-price-74d4bbcf
July 7,2023
Risk, Anyone?
Yesterday's headline from the Wall Street Journal, "America's retirees are investing like 30 year olds" was a bit of a head scratcher. Do they know something the rest of us don't or has the "stocks for the long run" infection taken such a deep root that valuation and risk have been sloughed off as worries of the past?
Let's take a look at the basic investment choices available to a 65 year old today. Our investor is an Oregon resident and thanks to a robust savings and investment habit over his entire life, he still earns investment returns in the mid-top tax bracket. With a goal of growing capital over his lifetime in order to leave a legacy to his children, he is not opposed to long maturity assets.
As the WSJ article reported, these investors are spread among S&P 500 Index funds, Nasdaq 100 portfolios, and even some day traders that use leverage. The earnings yield on the SPY currently sits at around 5% (inverse of the p/e ratio). As our research has proved, going all the way back to 1957, the S&P 500 (with all dividends reinvested) has shown the ability to return AT LEAST it's earnings yield over the subsequent 20 years. With a strong correlation between earnings yield and subsequent minimum expected returns, our investor has written off the probability of earning the oft quoted "10% over the long term" given the fact that current valuations limit the likelihood of this outcome.
Let's remember again, this investor owes a 50% tax on his interest income, high turnover mutual funds, and short term capital gains (37% fed + 3.8% medicare surtax + 9.9% oregon state tax). He looks up at the TV and sees a strategist celebrate the "new bull market". His brokerage firm statement includes an offer for him to finance his tax bill or next vacation with a securities based loan. The commercials advertising crypto currency, hedge funds, and alternative investments invite him to belly up to the bar.
Then it hits him: "If nobody is talking about yield or safety right now is it possible that I could earn my desired long term return by actually reducing risk rather than walking further out the risk plank?" It costs nothing to do some research to find out. Our investor had maintained a 70/30 stock/bond allocation through his working years but is now considering reducing his exposure to stocks. On this particular day, he spots a AA rated zero coupon Oregon school district double tax exempt (state and federal) municipal bond trading at a yield of 5% and maturing in 30 years. The basics of this security are simple: purchase it at .22 cents on the dollar and it matures to $1 at maturity. He is agnostic to the price along the way because it will go to his kids or favorite charity when he dies. A 5% double tax exempt yield has the taxable equivalent of 10% (the yield he would have to earn on a long US treasury in order to net 5%). Our investor opens up the financials of the school district and sees that it has operated and budgets for a surplus and the bond is backed by the full taxing authority of the school district if they need to raise capital. He is intrigued and directs his broker to buy. At settlement, he reads the trade confirmation that shows that he has just found a way to quadruple his investment at the top of the capital structure with no tax and has no exposure to the stock market.
He reads the WSJ article one more time and realizes that the retirees who are 100% invested in stocks must value the dollar they would like to have more than the dollar they already have. Satisfied with his decision, he closes the paper and heads out to make his tee time.
August 12, 2022
40 YEAR ANNIVERSARY OF THE 1982 BEAR MARKET LOW: HOW WELL DID THE EFFICIENT VALUATION HYPOTHESIS PERFORM FROM THIS HISTORIC DAY?
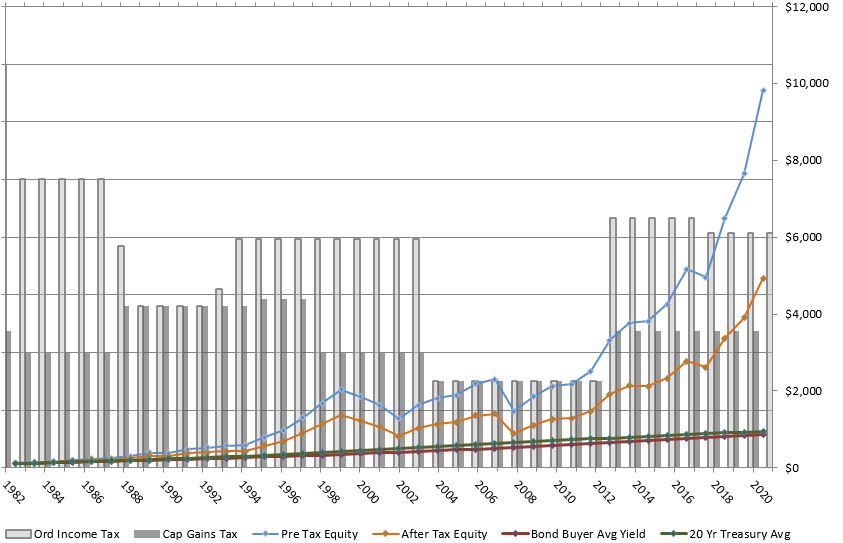
40 years ago today, August 12, 1982 the US stock market saw the 16 year flat/bear market end and a new bull phase begin. Measured against the closing value from that day, both the Dow Jones and S&P500 would compound for the next 40 years at a rate of 12%. More impressive growth of capital, however, was delivered by the bond market as 30 year US treasury bonds were selling at yields of 14%.
For those who have followed my Efficient Valuation Hypothesis note this: the earnings yield on both the Dow Jones and S&P in 1982 was also 12%. The hypothesis predicted that stock performance would be 12% or better which history proved to be correct. It also gave investors a clear signal that there was a free lunch available in the bond market and that bonds would likely out-perform stocks by simply comparing yield to earnings yield. The Random Walk Theory is false over the long term.
Financial Models
3/12/2021: BREAKING: AVERAGE US INVESTOR BEAT THE FORBES 400 FOR THE LAST 20 YEARS
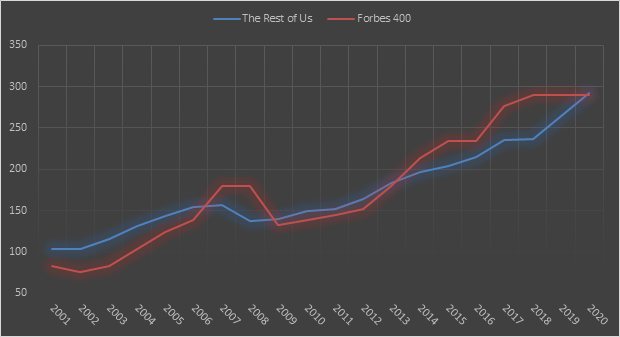
The Fed released a stunner yesterday: US household net worth clocked in at $130 trillion at year end 2020. Accounting for what most would call two extremely turbulent decades, US households grew their net worth at an annualized rate of 5.5%. When compared with the qualifying net worth to be named to the Forbes 400 list (which came in at 5.46% over the same 20 years), John Q Public won the race. If you think the Forbes group hold an outsized slug of US household wealth, think again. In October, Forbes announced that the cumulative net worth of the 400 was $3.2 trillion. The other $127 trillion belongs to the rest of us.
Astute investors know that the above does not adequately capture those who did not participate in the economic expansion: those who are in debt from credit cards, student loans, who are not covered by a pension. There is much ground to be made up for this demographic.
Tailored Wealth Management Readers: The above is an update to the data in Chapter 4
1/22/2021: Today we are posting the since inception after-tax return on the S&P 500 (1957-year end 2020). Note that the after-tax return of the index (pre-liquidation) was 7.57%. After-liquidation the after-tax return was 7.23%. Over the 63 years studied, the average yield of the 20 year US treasury bond was 6.02% and the average yield on the Bond Buyer Index of General Obligation Tax Exempt Municipal Bonds was 5.41%. The after-tax premium earned on a stock portfolio versus a municipal bond portfolio was thus 1.82%. As you review the data on the first page, note that pre-tax returns are compared to the taxable 20 year US treasury bond (most useful to non-taxable entities such as foundations, endowments, and pension plans), and the after-tax returns are compared to the bond buyer 20 bond index. Note that with each of the fixed income instruments, compounding at the average yield rate could only be experienced by an investor owning a stripped zero coupon treasury bond (non-taxable entities) or a non-callable tax-exempt zero coupon municipal bond (ultra high net worth taxable investors).
Click below for the most recent update to the full history of the S&P 500 compared to fixed income:
Readers, individual investors, and academic research professionals are encouraged to contact us with questions/ clarifications below.
Contact me

_w200_h/tailored-wealth-management(1)_02070807.jpg)